
I’ve been football trading for a long time and one thing I know for sure is that it can be difficult to know exactly when a goal is going to be scored.
If you are trading the overs markets, you ideally want to know when the goal is coming so you can enter your trades at the optimum time and get the best price on offer.
Likewise, if you are trading the unders and a game is getting ‘hot’, you’ll want to jump ship and get out of your trade before a goal goes in.
Below I offer a few ideas and suggestions on different ways you can work out whether the net is about to bulge or not.
BETFAIR CHARTS
When you’re watching a football match, you can often get a better idea as to whether a goal is imminent or not.
However, if you are not watching the match one great way of understanding the probability of a goal being scored is to look at one of the Betfair charts on the overs markets.
I will generally look at the O2.5 market in-play and what I am looking for is for the price to have ‘stalled’. What do I mean by stalled?
A market will naturally take the path of least resistance. This means in the overs market, you will sometimes see a steep drift in the price. Below you can see an example.
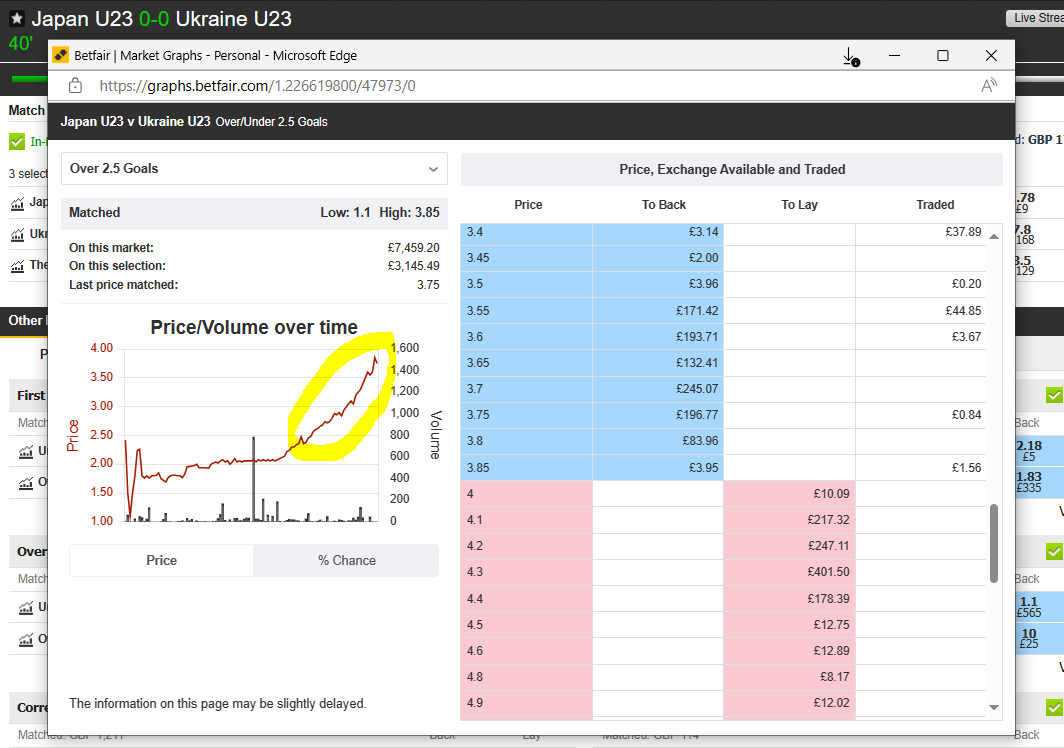
It means that there isn’t a balance in those backing and laying. It means that fewer traders are backing goals and more are laying. This causes a rapid drift in the price. In nearly all cases this will be due to a lack of goal-mouth action and in some cases a red card.
In the example below, you can see that the price has stalled. When I say stalled, I mean the price is now going sideways. The upward trajectory has ‘stalled’ meaning that the balance is shifting with more traders now backing the overs.
Sometimes you will see a price shorten as the balance of power moves with the backers.
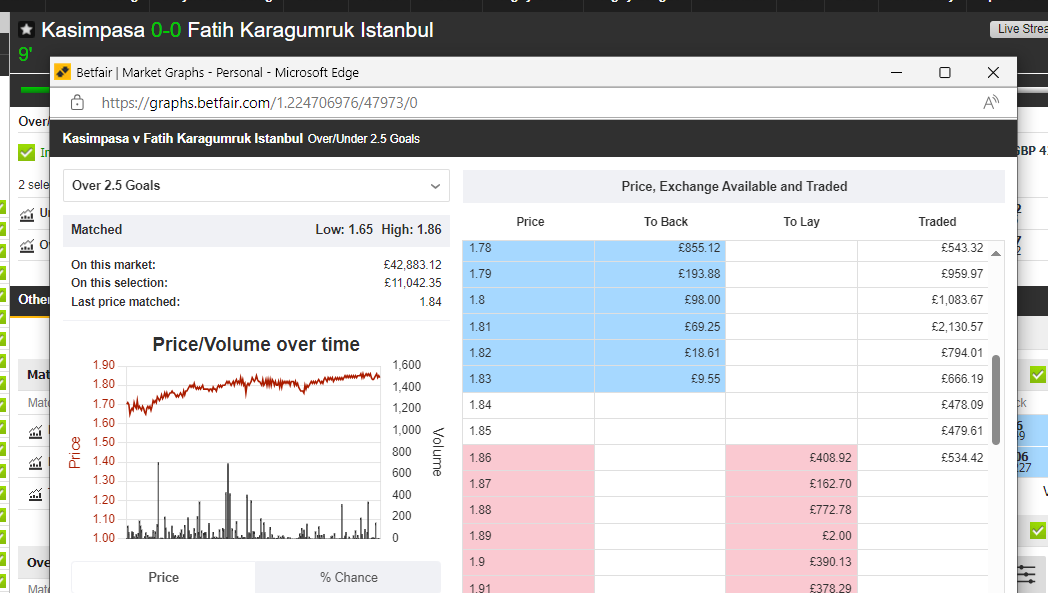
As you can see below, almost as soon as I took the screenshot above, the opening goal was scored.
I was watching this match and I could tell that from kick-off, it was end-to-end with both teams looking to score.
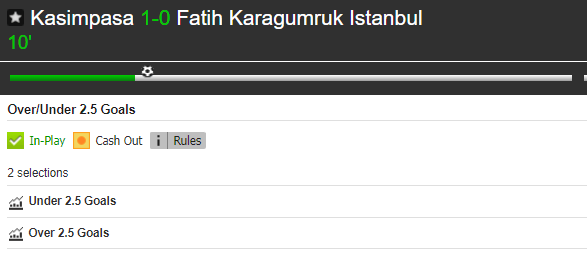
This happens all the time, and for me, is one of the most reliable goal signals to use and shows the direct correlation between the action on the pitch and the sentiment of hundreds if not thousands of football traders.
So if you are not watching a match, make sure you periodically keep your eye on the O2.5 chart for important hints on whether goals are coming.
SOT AND DANGEROUS ATTACKS
Another way to try and work out if goals are coming or not is to monitor the stats in play, especially the number of shots on target (SOT) from inside the box.
These can indicate whether the teams are creating quality goal-scoring chances or not.
In the past, I have entered my stakes into games where chances are being created but none are on target. This is something that I have regretted. These days, I prefer to see a shot or two on target before dripping my stakes in.
Likewise, shots need to come from inside the box. Teams can shoot from outside the box all day and not score so it’s important to make sure that the goal attempts are coming from inside the box. If they are not, then it could be a sign that the team/s are defending well and not providing the opposition with any quality opportunities to score.
Dangerous attacks are another way of gauging if a game has become ‘hot’ for goals. Matches will often start slowly but they can then pick up after 10 or 20 minutes. I like to see at least one dangerous attack per minute. If a match has played 20 minutes and there have only been 10 dangerous attacks, this can be a sign that teams are just feeling their way into a match and looking for weaknesses in the opposition.
If however, after 30 minutes the number of dangerous attacks has increased and is close to 30, this can be a sign that the intensity has increased and teams are starting to apply more pressure in their pursuit of goals.
GOAL WINDOWS
Many teams have the habit of scoring the majority of goals at certain times in their matches.
These I refer to as ‘goal windows’.
Some teams start fast and score the majority of their goals fairly early, whereas other teams tend to score more goals just before halftime, in the second half, or later in matches. This is evident when looking at the stats for any team.
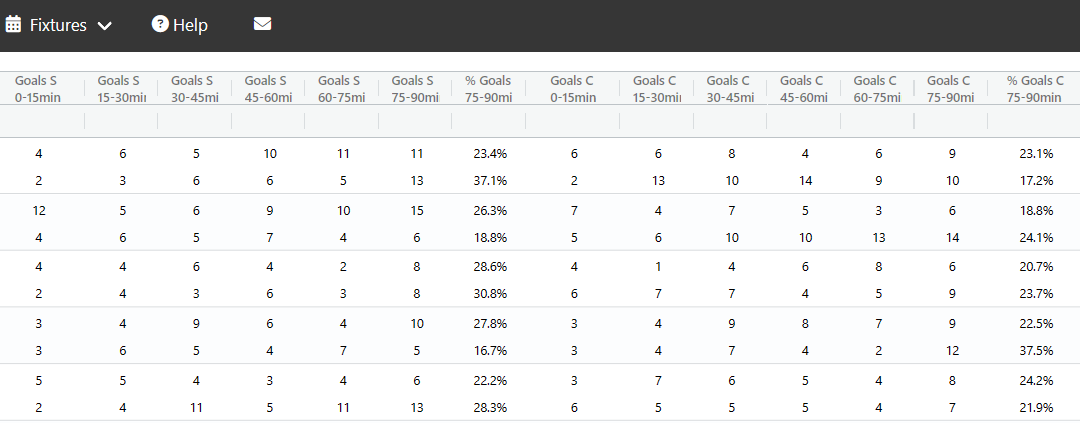
I’m a big fan of Soccer Scanner and what I will often do before a match is to paint a picture in my mind of when goals are most likely to be scored.
Soccer Scanner has a feature that you can use that shows you the distribution of goals for each team, both scored and conceded. By familiarising ourselves with these ‘goal windows’ we can get a better idea of when teams either score or concede the majority of their goals.
This then helps to time the entry into our trades better. It can also help to prevent you from entering trades too early in the mere ‘hope’ of goals.
WATCHING THE MATCH
Stats and charts are useful for sure, however, there is no substitute for watching a match to get a real idea of what is going on and whether goals are coming.
There is so much you can see when watching a match that you simply won’t see by looking at the raw in-play stats.
For example, you can’t always know what the atmosphere is like in the stadium. I watched England v Brazil on Saturday night and it was like a morgue at Wembley which for me reflected the game, although it was a friendly so this may have had a bearing on things. It was a pretty boring affair with few quality chances. You can’t see these things by looking at the in-play stats.

Another thing is urgency and body language. Sometimes you can even see it in the player’s body language, or the coach’s reaction on the sideline.
Or then there is the intensity. You can look at stats but watching the game will really help you to understand whether the intensity to score is growing or not.
Then there is the weather and playing conditions. These can also have a bearing on how a game is played. A little rain can be good, but too much can make the pitch sticky, meaning teams have trouble stringing passes together. Snow can also be an issue, although it won’t happen too often.
SUSTAINED PRESSURE
Sometimes you can look at Sofascores or a similar tool and see that a favourite/strong team has started off really fast and are on the hunt for goals. You see those large pressure spikes and these can be a real indicator that a team is really intent on scoring.
There is only so much pressure a team can take before they finally capitulate and the floodgates open.
Take for example this match I was following between Poland and Estonia. Poland were the clear favourites in the match and their intentions were all too clear from kick-off.
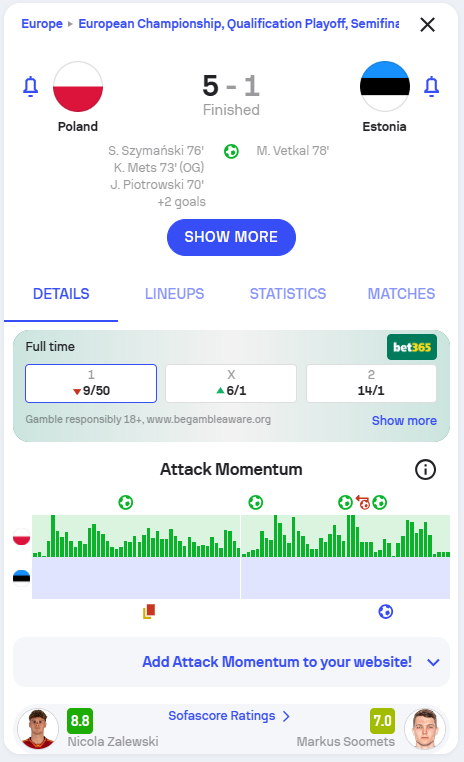
I slowly dripped my stakes into the O2.5 goals market on this one and was rewarded with the opening goal on 22’ from the home side.
Sometimes, it’s just a case of waiting for clear pressure from the favourites to suggest that goals are on their way.
MOTIVATION
Whether it’s for a Champions League place, promotion or to win the league, some teams simply MUST score. This will increase pressure and intensity and is the perfect time to find goals. A favourite (especially at home) who are losing, is a great place to find goals, especially in the second half after 60 minutes when there is less time to find one. These can be great opportunities to find goals.
BBC Coverage
I sometimes check the BBC coverage via their website for Premier League games as I personally don’t subscribe to all the different channels just to watch the odd football match.
The commentary will often tell you that there has been a “big chance”, or “hits the woodwork” or “great save” etc. These are all good clues that goals may be imminent.
Listening to the commentator’s language can be really helpful.
I was following a match recently and the commentator was very upbeat saying that he “couldn’t see this one ending 0-0”, that the game was “end-to-end”, and that goals were looking likely.
XG STATS
I don’t tend to put too much emphasis on this, but xG stats can give you an idea of whether quality goal-scoring chances are being created or not. Because xG stats are only increased after shots are registered, it is probably better to use these at halftime when you can see if quality chances have been created during the first half.
The higher the number of quality chances, the higher the xG stats in-play will be.
So that’s it!
A handful of methods to help you gauge whether goals are imminent or not when football trading in-play.
What’s your favourite?
FOOTBALL TRADING STRATEGY EBOOKS AND MEMBERSHIP
If you are interested in earning a second income from football trading, why not consider one of my strategy ebooks? Or alternatively, for just £10 per month you can join my Membership Program where you can receive all of my tips, watch trading videos and enjoy exclusive content.